 in
the field view toolbar turn the vector plot on and off.
in
the field view toolbar turn the vector plot on and off.
Vector plot shows the distribution of the vector quantity in the 3D region. For electric field presentation
it concerns E (field strength) and D (field displacement) vectors. Calculation region is covered by invisible uniform
grid with specified step. Then in the each node of this grid the vector is drawn as a directed straight segment (arrow).
Each arrow direction is agreed with the direction of the chosen vector quantity, and the length corresponds to the vector
module in chosen scale. The Vectors command in the View menu or the button in
the field view toolbar turn the vector plot on and off.
Note: Vector plot presentation may require considerable amount of computer resources (memory, processor time). It is thus advisable to gradually increase the parameters, which increase the load. Recommended presentation parameters are in the list.
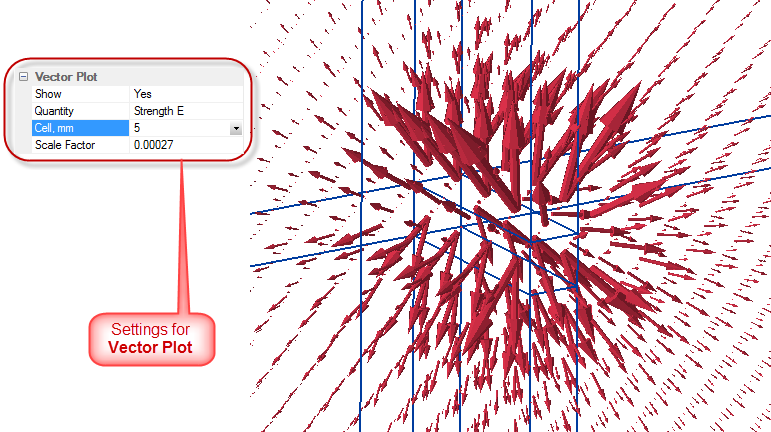
Pic. "Vector plot" presentation
Adjustment settings for the vector plot include:
Note: Vector plot presentation might be overlapped by the Color surface presentation. In this case it is recommended to switch off Color surface presentation.