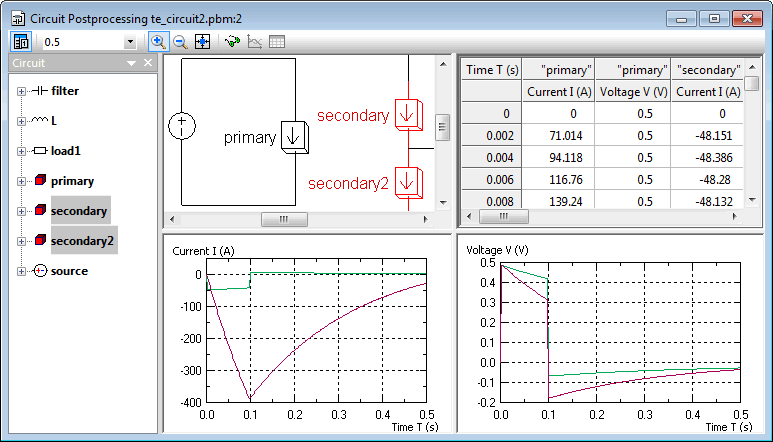
The window displaying the results for a transient magnetic problem with attached circuit might contain up to 4 kinds of different panes:
Electric circuit itself;
The time dependency graphs for the currents in the selected circuit elements;
The time dependency graphs for the voltages in the selected circuit elements;
The table of currents and voltages in all circuit elements.

You can resize the panes. You can also hide panes if there is not enough of window space for all of them. Twin boundary frames indicate the existence of hidden panes in between.
The plots are displayed curves are plotted for each selected circuit component. The correspondence between the curves and circuit elements is shown by using the same color of a curve and related line in the circuit element list. Curves are redrawn when the circuit elements are selected or deselected in the list or in the electric schema drawing.
The scale of xy-plot could be adjusted by corresponding toolbar buttons:  . Pressing the zoom-in button (with plus sign) changes the cursor shape to a cross, after that you can drag over the rectangle of interest.
The graph image could be printed, copied to the Clipboard, and/or saved to a file in any of the supported raster or vector formats. To do that, invoke the corresponding commands in the context (right-click) menu of the graph.
The table of circuit currents and voltages could be printed, copied to the Clipboard, and/or saved to a text file. To do that, invoke the corresponding commands in the context (right-click) menu of the table.
See also:
Electric circuit analysis
Electric circuit components list