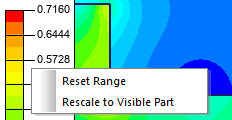
Color map legend
The legend shows the correspondence between colors in the field picture and their numerical values. To open/hide the legend click the Legend button in the toolbar.

In the legend window, you can manipulate the range of the color plot:
- Click within the color bar and hold mouse button while moving up or down to narrow (zoom in) the range to the positions where the button was pressed and released.
- In the context menu choose the "Reset range" on "Rescale to Visible part" to return the range to its default setting. Double-click within the color bar works the same way as the "Reset range".


