X-Y plots
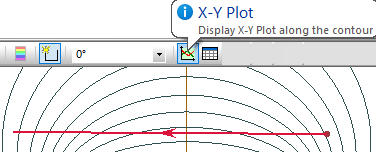
You can analyze field distribution along contours. To open new X-Y plot window, choose X-Y plot in the View menu.
In X-Y plot view, you can:
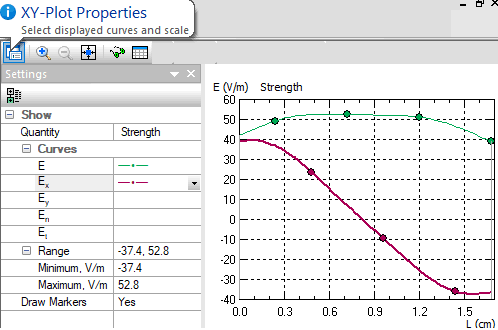
- Select the set of displayd quantities. Choose XY-Plot Properties in the View.
- View the correspondence between quantities and curves.
- Zoom the plot in or out.
- Copy the picture to clipboard or export to a file.
- Open new X-Y plot window for the same contour (menu Window > New Window)
Single X-Y plot can show several quantities of the same unit of measurement at once. Quantities are combined into groups. To select quantity, choose the group in the Quantity drop-down list. Then you can switch off and on individual curves.
You can also edit Minimum and Maximum values of Y-axis of the plot.
To manipulate X-Y plot appearance, switch on or off markers.