 turn the scatter plot on and off.
Scatter plot is somewhat similar to the Vector plot, but designed to visualize the spatial distribution
of the scalar quantity. Physical parameter value is shown by the color, which paints the small balls shown in
the finite element mesh nodes. Scattered spheres command from the View menu or the field view toolbar button
turn the scatter plot on and off.
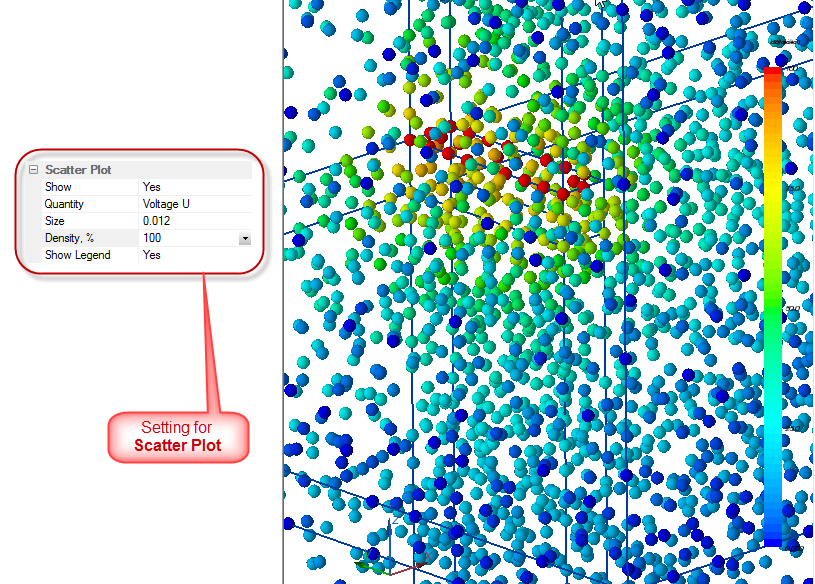
If the number of finite elements is high, then for the nodes for scatter plot presentation are randomly selected with total number not exceeding 10 000.
Scatter plot settings include:
Note: Scatter plot presentation might be overlapped by the Color surface presentation. In this case it is recommended to switch off Color surface presentation.