Working with field pictures
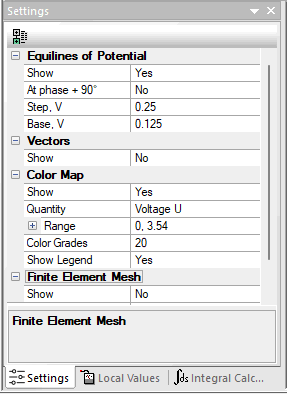
When you start analyzing the solution QuickField opens a new window showing the calculated field picture in the most appropriate mode for the problem type. If necessary, you can change the viewing mode or combine several viewing modes together using the View / Settings pane.
While editing any scaling parameter, you can use Suggest to get the default value of the parameter, calculated with respect to visible part of the region.
Although you can invoke all the solution analysis actions via menu or the Settings pane, the toolbar
associated with the field picture window provides easier and more convenient interface to most of them.
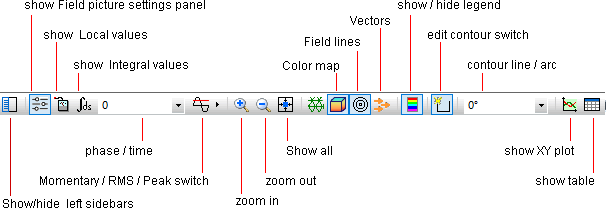
The following field picture analysis features are specific to time-dependent problems:
- For transient problems, QuickField calculates the results for the specified time interval with the field picture window displaying the snapshot related to a single time moment. By default, it is the last moment of the interval. You can change the displayed moment specifying another value in the Time/Phase toolbar window. Such change would also affect the field calculator window and other windows (tables and plots) related to the field picture.
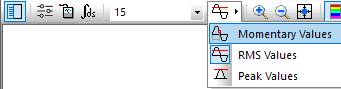
- For time-harmonic problems, you can choose the presentation mode specifying
which kind of values the window displays:
- RMS values, or
- Peak (amplitude) values, or
- Momentary values for the given phase.
To choose the mode click the corresponding item in the toolbar drop-down menu:
In the Time/Phase combobox you can additionally specify the desired phase value in degrees.
Analyzing the field picture window you can:
- Select the field presentation and adjust its settings in the Settings pane (View / Settings).
- View the same field picture in several windows. You can do that either by opening a new window (Window / New Window), or by splitting the existing window into two or four panes (Window / Split).
- Zoom the picture.
- Select the displayed Time Layer for transient problems, or the displayed phase for time-harmonic problems.
- Display the local field data at the given points.
- Create and modify the contour for the field analysis process.
You can build one contour in every field window and use it as follows:
The picture can be saved to a file.
To save the field window settings and the associated contour for future, use File / Save Status. To restore the saved settings, use File / Restore Status.
Showing a field picture as color map QuickField displays the legend that establishes the correspondence between colors and intervals of the field values.