Electrical resistivity tomography - QuickField simulation example
QuickField can generate a sample dataset to test the electrical resistivity tomography (ERT) or electrical resistivity imaging software.
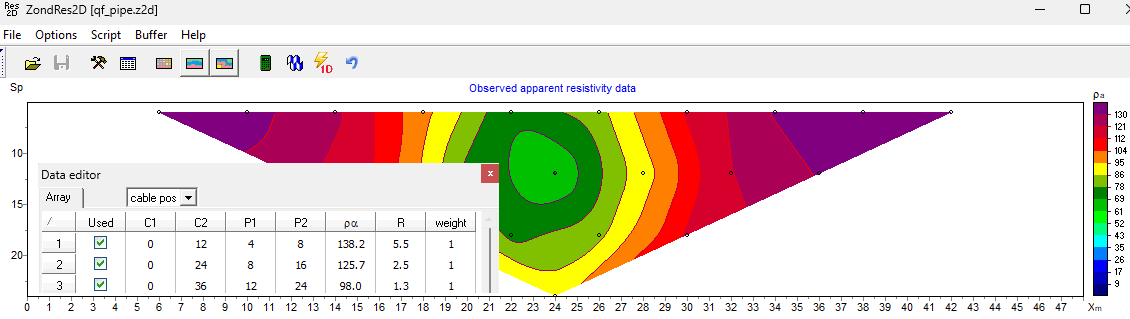
In the model we have a layer of clay and an underground water flow. Electrodes are distributed on the earth surface. A four-probe method (Wenner) is used to measure the DC resistance between the electrodes. Then these data are processed by the ZondRes2D software package to construct the underground pseudo-section.
Engineering question
How to find soil resistivity Wenner array?
Answer Set up a plane-parallel QuickField DC Conduction problem for a Wenner electrode arrangement and evaluate soil resistivity from computed field results.
Problem Type Plane-parallel problem of DC conduction.
Geometry
Given Electric conductivity of clay 0.02 S/m; electric conductivity of water 1 S/m;
There are 14 electrodes. Spacing between the electrodes is 4 m.
Injected current is I = 1 A.
Task Calculate the electric potential drop between the electrodes.
Solution In a four electrode array the current is supplied to the C1, C2 electrodes, and the electric potential drop is measured between P1 and P2 electrodes. In QuickField we specify the current source at the C1 and zero electric potential at the C2. No other field sources are specified so the current flows from C1 to C2.
In the real case the electrodes are thin wires and the current flows freely in all directions (x,y,z). In plane-parallel approximation we artificially limit the current to flow only in the x,y-plane. To simulate a real case you need to solve the 3D DC conduction problem, which is possible, but time consuming.
Calculations are automated using Microsoft Excel with VBA macros.
Results
Data for subsurface imaging
Electrodes #
a, m
V/I/a
C1
C2
P1
P2
0
3
1
2
4
11
1
4
2
3
5.3
2
5
3
4
4.9
3
6
4
5
3.9
4
7
5
6
2.8
5
8
6
7
3.3
6
9
7
8
4.5
7
10
8
9
5.2
8
11
9
10
5.4
9
12
10
11
5.5
Electrodes #
a, m
V/I/a
C1
C2
P1
P2
0
6
2
4
8
2.5
1
7
3
5
2.2
2
8
4
6
1.5
3
9
5
7
1.2
4
10
6
8
1.8
5
11
7
9
2.4
6
12
8
10
2.6
Electrodes #
a, m
V/I/a
C1
C2
P1
P2
0
9
3
6
12
1.3
1
10
4
7
1.0
2
11
5
8
1.1
3
12
6
9
1.5
Electrodes #
a, m
V/I/a
C1
C2
P1
P2
0
12
4
8
16
0.9
Electric potential measurement with QuickFieldSubsurface imaging in ZondRes2D