Spark plug electric field - QuickField simulation example
Engineering question
How to find electric field in spark plug gap?
Answer
Set up a 3D QuickField Electrostatics problem for a spark plug gap and evaluate electric field distribution from computed field results.
Typical applications
spark plug electrodes, ignition systems, high-voltage ignition gaps
Download
- Download simulation files (files may be viewed using any QuickField Edition).
Simulation problem
Problem Type electrostatics.Geometry 3D import.
Given
Relative permittivity of insulator ε = 5,
High DC voltage V = 15 kV.
Task
Calculate the electric field stress distribution in the spark plug air gap.
Solution
We simulate only the area around the spark gap. The other parts of the spark plug are excluded.
To overcome 3D import limitations (only single body topology is allowed) we added small
air gap within the internal part of the high voltage electrode, which does not affect the physics but converts the topology to a single-body one.
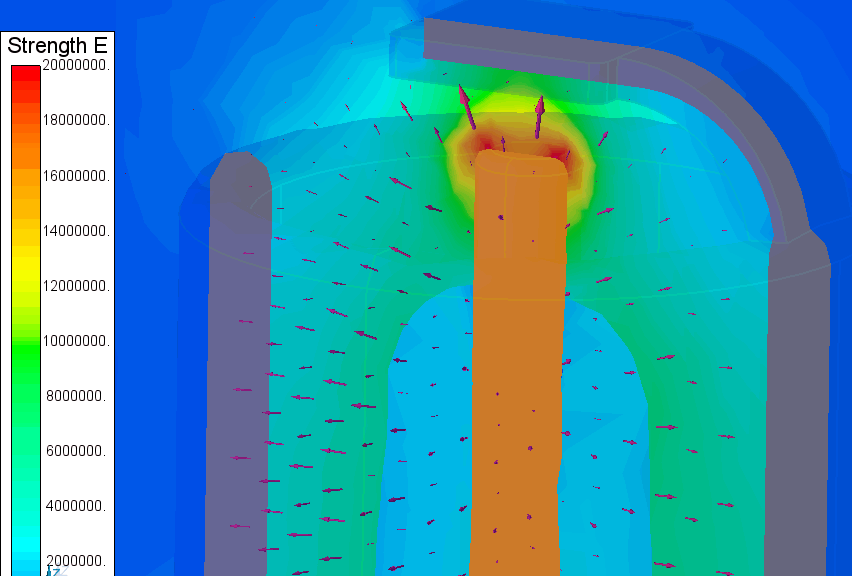
Results
Electric field distribution in the spark gap:
Video
- Spark plug electric field. Watch on YouTube
00:00 Introduction
00:55 Transfer CAD model to QuickField through STEP file export/import.
02:40 Adding background region to the model. Selecting objects
03:25 Body labels' assigning. Hide/made transparent the body.
05:45 Selecting with rubber band.
06:20 Edit body labels physical properties
07:15 Boundary conditions on faces.
09:10 Model meshing, manual spacing adjustment. Problem solving
10:50 Result analysis. Colored surface. Cut by plane.
12:30 Result analysis. 2D Section window local values, integrals. XY-plot along the custom contour. Local values, integrals.
13:50 Result analysis. Local values, integrals.
14:40 Result analysis. Change presentation types: slice plot, vectors, isosurface plot.
15:30 Result analysis. Hide bodies, local and integral values, XY-plots.