Suspension insulator - QuickField simulation example
Disc insulators are connected in chain of two. The insulators are suspended from the grounded tower arm and carry HV power line conductor.
How to find electric field distribution along suspension insulator?
Answer Typical applications Geometry 3D import.
Given
Task
Solution
Results
00:00 Introduction
Engineering question
Set up a 3D QuickField Electrostatics problem for a suspension insulator and evaluate electric field distribution from computed field results.
suspension insulators, overhead line insulators, transmission line insulation strings
Download
Simulation problem
Problem Type electrostatics.
Relative permittivity of the insulator (glass) εr = 5,
Transmission line potential V = 10 kV (RMS, line to line voltage).
Ground voltage = 0 V.
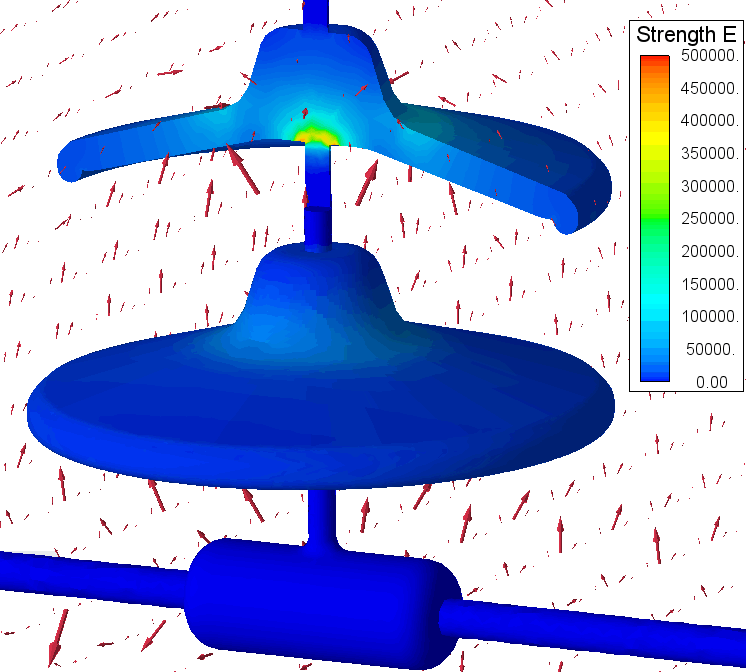
Calculate the electric field stress distribution on insulators surface.
Line voltage is measured between the phase conductors. The phase voltage (between phase conductor and ground) is √3 times smaller than the line voltage.
We should specify the peak voltage value (*√2).
Electric field stress distribution along the suspension insulators' surface.
Video
00:50 Transfer CAD model to QuickField through STEP file export/import.
02:40 Adding background region to the model. Selecting objects
03:40 Body labels' assigning. Hide/made transparent the body.
06:10 Selecting with rubber band.
07:05 Edit body labels physical properties
08:05 Boundary conditions on faces.
10:55 Model meshing and problem solving
11:25 Result analysis. Colored surface. Cut by plane.
12:55 Result analysis. 2D Section window local values, integrals. XY-plot along the custom contour. Local values, integrals.
15:40 Result analysis. Local values, integrals.
16:05 Result analysis. Change presentation types: slice plot, vectors, scatter plot. XY-plots.
Related examples