Electric field mapping
Electric field mapping usually includes plotting of the equipotential lines and color map display of the electric field stress distribution. QuickField software offers all this and more.
Electric field mapping of the equipotential lines with QuickField software may be controlled by choosing the interval between the field lines and the base line potential.

Pic. Equipotential lines field mapping with QuickFIeld
Electric field mapping as a color map in QuickField may be adjusted by the number of color grades and the maximum and minimum of the displayed quantity.
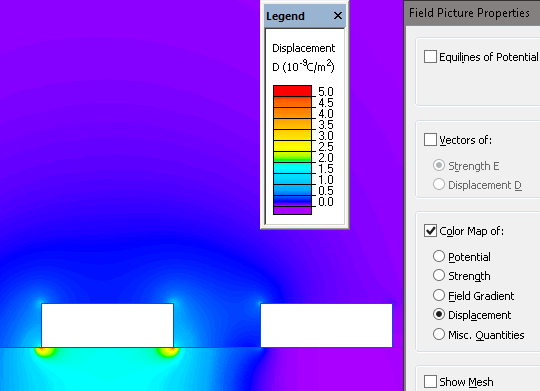
Pic. Color mapping of the electric displacement distribution in QuickField
Other forms of the electric field mapping offered by QuickField software include display of the vectors of the electric stress and electric displacement on a rectangular mesh with controlled scale and cell size.
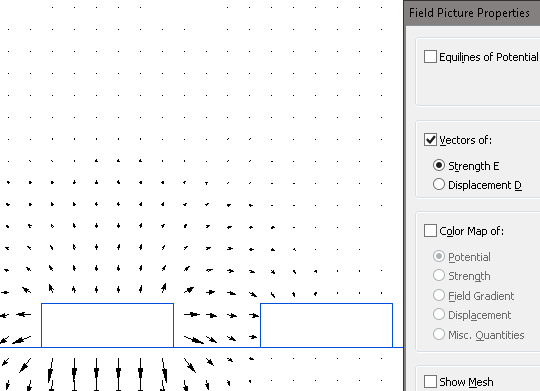
Pic. Vector field mapping with QuickField software.