Temperature field mapping
Traditional ways of the temperature field mappings are isotherms plotting and temperature field color map presentation. QuickField software allows both these field mapping options, and also may show vectors drawn in the nodes of the rectangular grid.
Temperature field mapping with isotherms using QuickField may be controlled by specifying interval between the isotherms, and temperature of the base line
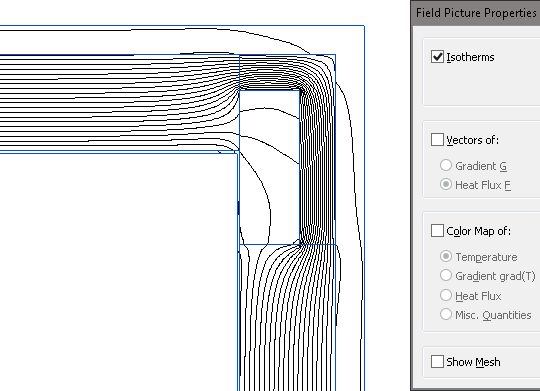
Pic. Temperature field mapping with isotherms using QuickField
Color mapping of the temperature field with QuickField shows the picture where colors correspond the temperatures. Other thermal parameters which may be mapped this way are thermal gradients, heat fluxes and thermal conductivities. The display may be adjusted by setting the color grades and maximum and minimum values of the chosen quantity.
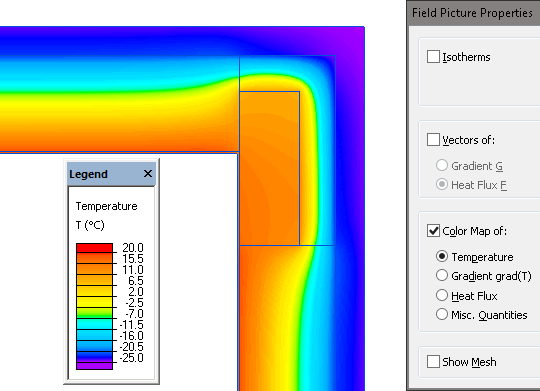
Pic. Color mapping of the temperature field with QuickField
Vector presentation is convenient way of the field mapping for displaying the thermal gradients or heat fluxes. Vectors are drawn in the nodes of the rectangular grid with specified scale and grid cell size.
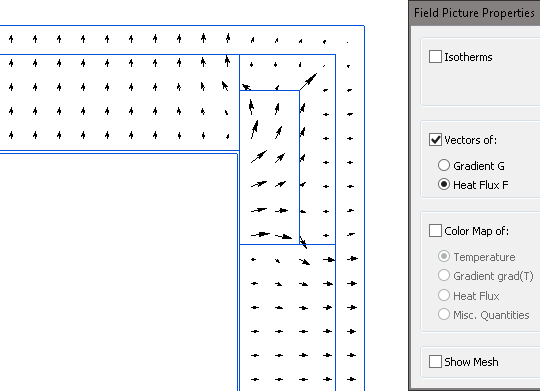
Pic. Vector thermal field mapping with QuickField software