Contour for plots and tables
Contour for making a plot or table of the field distribution is a flat broken line, built from one or more segments. To start creating a contour click the  button on the toolbox. The cursor will change its shape to a cross-hair. Click mouse button to create the initial node and then drag the mouse till the next node. Each left mouse click generates the new node. Right mouse click makes the last node. If the last node coincides with the first node, the contour will be closed polygon.
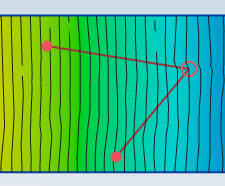
After creating the last contour node, it turns to the mode which allows dragging existent nodes by the mouse or creation new nodes on the edges. To pull the node you need to move the cursor to the node to change its color, and drag the cursor with the right mouse button pressed. Doing the same with the middle point of the contour will create a new intermediate node.
When the mouse cursor is over the contour, right mouse button click activates the context menu with contour editing commands:
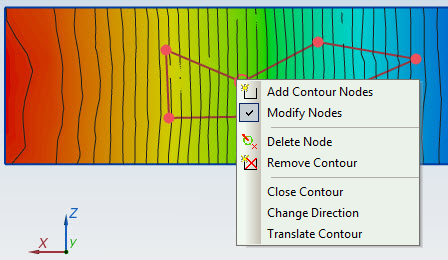
- Two upper commands select one of the alternative contour modes: adding new segments to the end of the broken line, or dragging the existent nodes. Next two commands remove the selected node or the whole contour.
- The contour is always directed, i.e. it is known which nodes are first and last. Contour direction may be changed using the Change Direction command.
- Translate Contour command allows dragging the contour as a whole by the mouse.
Context menu commands for the contour manipulation are also included into the Contour menu.