Isosurface plot
Isosurface plot presentation displays the surfaces of equal potential. Surfaces could be
monochromatic or color painted according to the potential values. Each of surfaces will always have
a single color. The command Isosurface plot from the View menu or the button
 from the field view toolbar switches this presentation on or off.
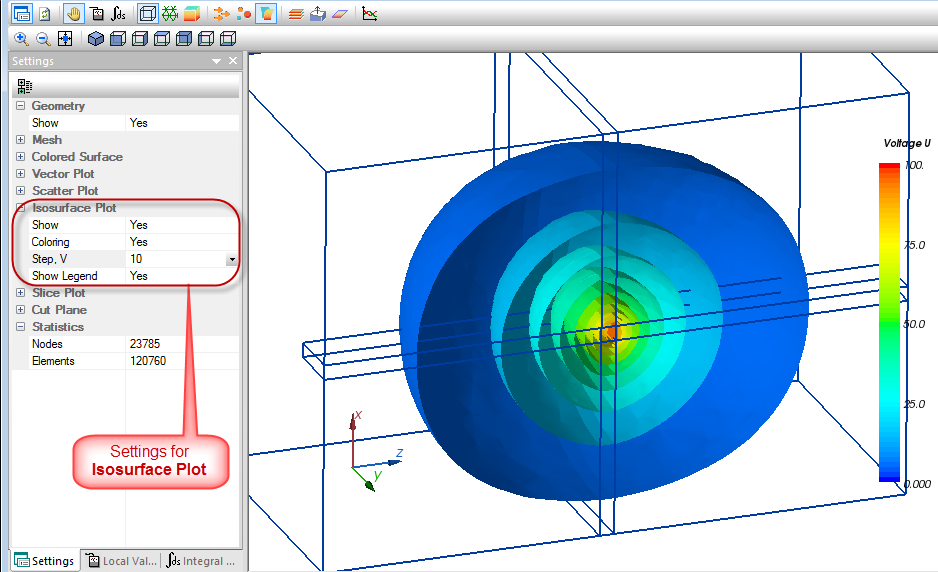
Pic. "Isosurface plot" presentation
Selection of the physical quantity for isosurface plotting is not provided – it is always potential U in the electric problems, temperature T in the thermal problems etc.
Isosurface plot settings include:
- Whether the surfaces should be colored according to potential values
- Potential step ΔU between the neighboring surfaces
- In case the color surfaces selected – whether the color legend should be shown as well