Multiple parallel cuts – slice plot
It is often useful to use not one, but multiple cut planes for complete field analysis. Presentation
Slice plot is provided for such situations. Command Parallel Slices from the View menu or the button
 in the field view toolbar turns this presentation on and off.
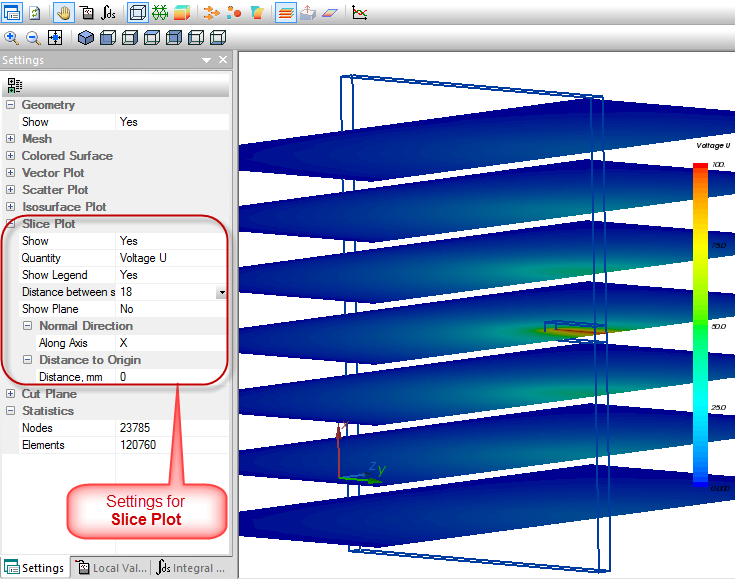
Slice plot presentation.
Similarly to cut plane, when the Slice plot presentation is turned on, the interactive controls – plane and normal vector – are displayed. Manipulating with these controls adjusts the orientation of the cut slices family.
Selected physical quantity color map is shown on the parallel slices. When the slice plot presentation is turned on, color surfaces are automatically turned off to make the slices visible.
Slice plot settings include:
- Choose of the physical quantity to be displayed as color maps on the slices. List of available choices includes all scalar quantities.
- Show or hide the color legend.
- Distance between the slices. Recommended values may be selected from the list, or arbitrary number may be entered.
- Show plane which may be Yes or No turns the visibility of the cut plane and normal vector on and off.
- Two groups of fields including Normal direction and Distance to Origin control the position of the cut planes same way as corresponding settings of the cut plane presentation.