Tables
Field parameter distribution along the selected edges or contour may be presented not only on a graph, but also as a table. Table window is activated by pressing the button  in the 3D field view toolbar (table along the selected edges) or in the 2D section toolbar (table along the contour).
Table rows are related to the geometry model nodes, evenly distributed along the contour or the selected edges group. Table columns are the physical parameter values.
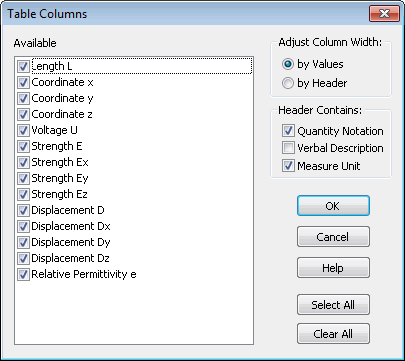
Table columns displayed may be modified by pressing the button  in the table toolbar or in the context menu using the "Table columns" dialogue.
To specify the number of the table rows you need to press the button  in the toolbar, which displays the dialogue window "Table rows".
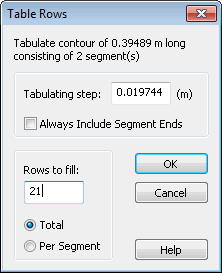
Number of the rows in the table may be defined directly, or by setting the desired space between the nodes in the model length units measured along the contour. If the contour consists from several segments, or there are several edges selected, dialogue allows defining different steps for different segments. All the segment ends are mandatory included into the table.