Plots along the model edges
Field parameters distribution along the selected model edges or contour may be displayed
in the plot. Plot window is displayed by using the command 1D XY Plot in the View
menu or by pressing the button  from the field view toolbar.
The plot shows distribution of the selected physical quantity along the selected edge or the sequence of edges. The plot is automatically redrawn with the change of edge selection. Sequence of edges for plotting should form the spatial contiguous not self-crossing. The edge selection suitable for plotting should form a contiguous line without self-crossing segments. Beginning of this line may coincide with the end – no other crossings are allowed.
The toolbar with standard buttons of scale control is located above the plot window.
The plot legend pane may be dragged and docked to any side of the plot window frame, or left floating.
The proper physical quantity for plotting may be selected in the legend pane. Radio buttons switch between the physical quantity families, and expand the selection of flags for choosing of the specific property from this family.
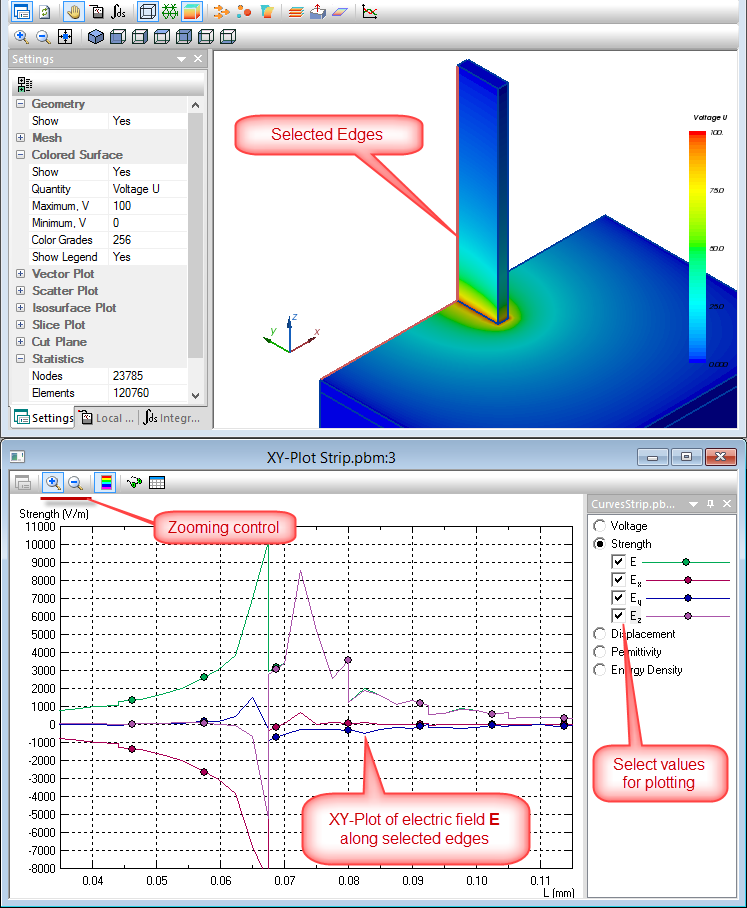
Pic. XY-Plot of the electric field E along selected edges
Toolbar above the plot area includes:

 Zoom buttons. To the left from the plot the legend pane is shown, which may be dragged to any side of the plot or left floating.
 The legend pane allows selection of the physical parameter for plotting. Radio buttons provide the choice between the parameter families, expandable set of the flags turns on/off the specific parameter within the family.
 This button returns to the field view which is associated with this plot. If the plot is drawn along the selected edges, the button activates the 3D field view picture. If the plot is drawn along the flat contour, the button activates the 2D section window, which includes the contour.
 This button activates the table window, which includes the distribution of the physical parameters along the edges or contour.
Right mouse button click activates the context menu.