Field Picture in AC Magnetics
Field Lines option switches visibility of flux lines at specified phase. Optionally, you can see second family of lines at phase shifted by quarter of period.
Vectors display magnitude and direction of magnetic field, strength, or Poynting vector as a family of arrows.
Color Map displays distribution of chosen quantity. You can choose between momentary values (at phase specified), root-mean-square (RMS) values, or peak values.
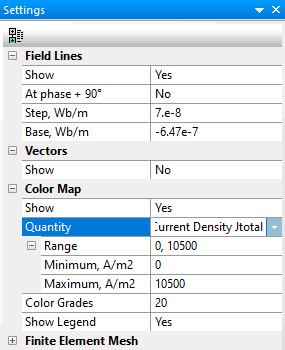
To display the momentary values, the phase is specified in degrees. This value of the phase is applied to all the displayed quantities. When you need the momentary values at a given moment of time t, e.g., for comparison with the transient solution, you can obtain the corresponding phase value using the formula
φ0 = -ωt0 = -360°·f·t0
where f - is the magnetic field frequency in Hz, time t is in seconds.
Note. The minus sign in this formula may appear odd and non-intuitive; nonetheless it is necessary to provide the commonality in the definition of the term "phase" when defining the sources and boundary conditions on one hand, and when post processing the momentary values on the other. Let us assume that the voltage is specified in the Data Editor to have a phase of 30°. According to the complex presentation U = U0·cos(ωt + φ), this means that the momentary value reaches its maximum at the moment of time ωt = -30°. This implies that the momentary value in the postprocessor must also be at the maximum when ωt = -30°, or at phase equal to +30°, QED.