Time Plot
For transient problems QuickField provides the means to plot time-dependent field quantities versus time.
You can display the plots of local field values at the given points. Plots can simultaneously show the curves for several field points.
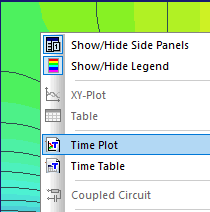
To create a new time plot, right click any point in the field view and choose Time Plot in the context menu. To display the curves related to different points on the same time plot, click the points one by one in the field view invoking the Time Plot command after every click. Or, to specify the exact point coordinates, invoke the Time Plot Curves from the Time Plot window.
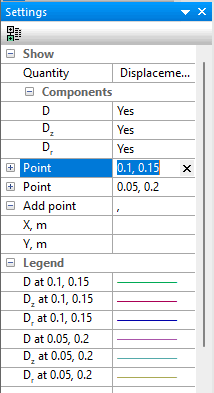
With the Time Plot Curves you can:
- Add and remove points. You can also change point coordinates.
- Define the set of curves displayed for various groups of physical values. To do it, choose Time Plot Curves from the View menu.
- Zoom the plot in or out.
- Copy the picture to the clipboard or export it to a file.