Time Plot Curves
A time plot window can display curves for several points. In turn, for each point can have several curves for different field quantities, combined into three families: temperature, temperature gradient, and heat flux.
To add a new point, click the very first row in the list, type coordinates in the boxes above and click the Add button. When choosing a point in the list you can change its coordinates and switch on and off associated curves.
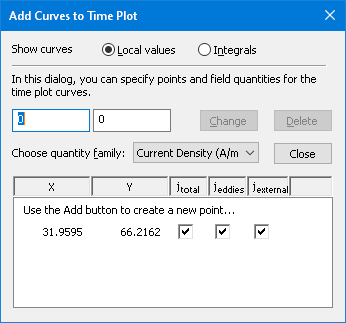
The Choose Quantity Family drop-down list at the bottom allows you switch displayed curve family. Alternatively you can choose the family in context (right mouse click) menu in time plot window or in a legend.
The time plot window immediately reflects all action you do in the dialog. You can close the dialog and open it again in any time.