Field picture in the cut plane
When the cut plane presentation is selected, the field picture in the in the section may be presented
in 3D view, as it was shown in the previous paragraph, or as a 2D view in separate window. 2D field view
in the cut plane window may be turned on by pressing the button  in the toolbar.
This button is active when the presentation "cut plane" is selected.
in the toolbar.
This button is active when the presentation "cut plane" is selected.
2D field view window is similar to 3D view window. It includes the toolbar, two panes of the field calculator stacked at the left, and a field picture window with coordinates and color legend.
Picture control principles for 2D window are the same as for 3D field view window. Image also consists from separately turned on/off presentations – model geometry, finite element mesh, colored surface and isolines plot (for the lines of equal potential)
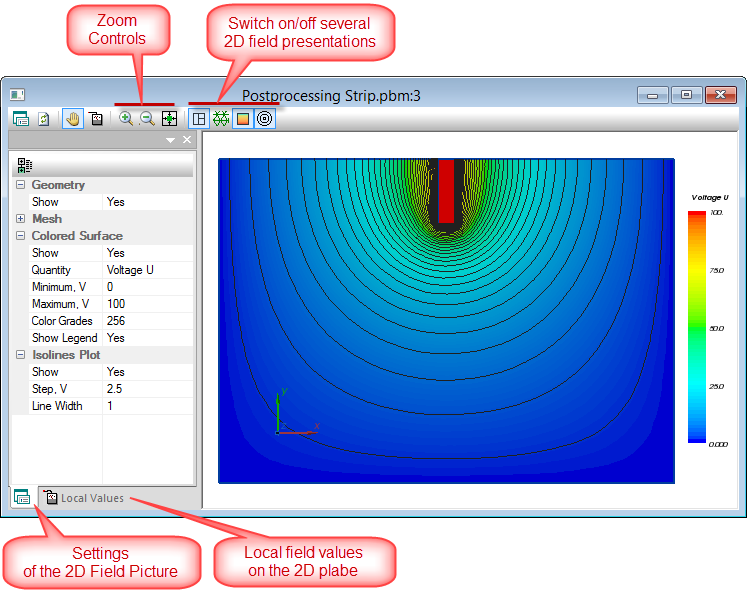
Pic. 2D field picture in the cut plane
Pic. above shows three presentations of the 2D field: geometry model, colored surface and isolines. Mouse gestures which control the field view are the same as in 3D case with obvious exceptions: model cannot be rotated, cut plane is always positioned in the screen plane.
Local and integral values
Cut plane allows browsing the local field values similarly to how it could be done in 3D window.
The tab "Integral calculator" in the 2D window provides calculation of the integral values over the whole planar section, e.g. vector flux across the section. Surface integrals are calculated over all the visible bodies cut by the section plane.
Field distribution in the section plane may be also displayed as a plot or table. Table and plot present the field along the broken line contour consisting from one or more segments. Method of the contour creation in the 2D section window is explained here.
When the contour is ready, press one of the buttons  in the toolbar to activate the plot or table window. If the table or plot window is already open, pressing the button 1D Plot or 1D Table changes the window content accordingly to the current contour.